Engine Metrics
Flexify.IO Engine includes Prometheus exposer that exports multiple metrics. The exposer is inactive by default and must be configured in the engine’s configuration.
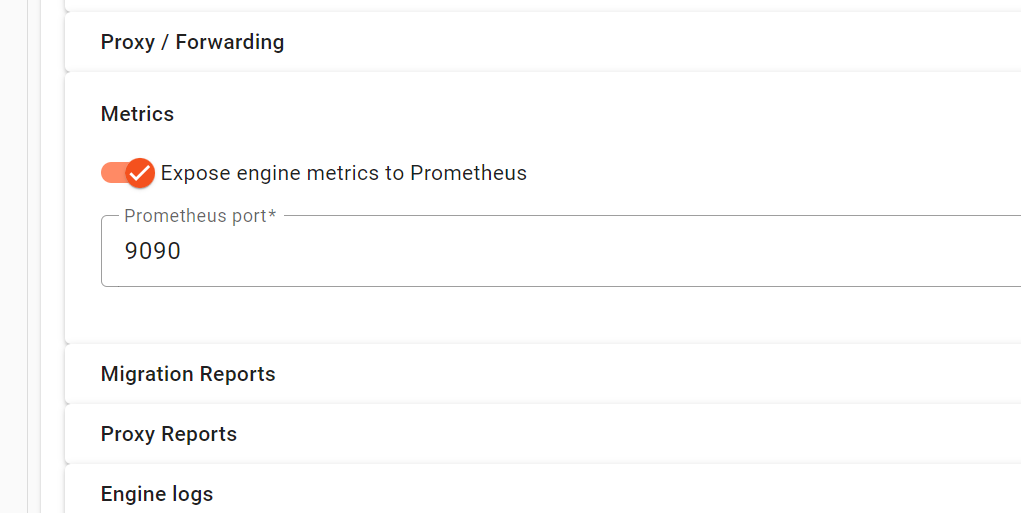
The port should be different from proxy port(s). Encryption (HTTPS) and authentication are not supported.
Exposed Metrics
Each engine instance expose multiple metrics. We recommend monitoring all metrics and configuring alerts based on your use case.
Symbol ⚠️ indicates metrics conditions that should be monitored first of all.
Make sure to monitor the Prometheus targets health as well. Some failures may result in Prometheus being unable to collect metrics and impotent metrics changes missed.
System
Metrics related to overall system status.
Metric | Labels | Description | Observation |
|---|---|---|---|
| none | Gauge. Number of vCPU in the system. | - |
| none | Gauge. Total system CPU usage from | Should not go above 80% of CPU count over 5 minute interval. |
| none | Gauge. CPU used by this engine process. | Should not go above 80% of CPU count over 1 minute interval. |
| none | Gauge. Total RAM available on the system. | - |
| none | Gauge. Free RAM as reported by the system. | It’s normal for the value to go low due to RAM used by discardable cache. |
| none | Gauge. RAM allocated to this engine process. | ⚠️ Should not be above 75% of total memory and should not increase over time or dramatically increase over average values. |
| none | Gauge. Virtual RAM used by engine process. | It’s normal for value to go high due to discardable cache. |
| none | Gauge. Physical RAM used by engine process. | It’s normal for value to go high due to discardable cache. |
Tasks
Metrics related to tasks assigned to this engines.
Migration tasks
Metric | Labels | Description | Observation |
|---|---|---|---|
| none | Gauge. Number of active migration tasks on this engine. | Should not be extremely high. |
| none | Counter. Total number of migration tasks received by the engine. | Should not grow too fast. |
| none | Counter. Total number of migration tasks changed (such as storage key). | Should not grow too fast. |
| none | Counter. Total number of finished (successfully or not) migration tasks on the engine. | Should not grow too fast. |
| none | Counter. Total number of failed migration tasks on the engine (either failed to start or started but failed). | ⚠️ Should not grow at all. |
Storage Cleanup tasks
| none | Gauge. Number of active storage_cleanup tasks on this engine. | Should not be extremely high. |
| none | Counter. Total number of storage_cleanup tasks received by the engine. | Should not grow too fast. |
| none | Counter. Total number of storage_cleanup tasks changed (such as storage key). | Should not grow too fast. |
| none | Counter. Total number of finished (successfully or not) storage_cleanup tasks on the engine. | Should not grow too fast. |
| none | Counter. Total number of failed Storage Cleanup tasks on the engine. | ⚠️ Should not grow at all. |
Storage Info tasks
| none | Gauge. Number of active storage info tasks on this engine. | Should not be extremely high. |
| none | Counter. Total number of storage info tasks received by the engine. | Should not grow too fast. |
| none | Counter. Total number of storage info tasks changed (such as storage key). | Should not grow too fast. |
| none | Counter. Total number of finished (successfully or not) storage info tasks on the engine. | Should not grow too fast. |
| none | Counter. Total number of failed storage info tasks on the engine. | ⚠️ Should not grow at all. |
Forwarding (proxy) tasks
| none | Gauge. Number of active forwarding tasks on this engine. | Should not be extremely high. |
| none | Gauge. Number of active forwarding tasks that got errors (such as with failed settings update). | Should be none. |
| none | Counter. Total number of forwarding tasks received by the engine. | Should not grow too fast. |
| none | Counter. Total number of forwarding tasks changed (such as endpoint setting changed). | Should not grow too fast. |
| none | Counter. Total number times a forwarding tasks failed to start. | ⚠️ Should not grow at all. |
| none | Counter. Total number times a forwarding tasks failed to update. | ⚠️ Should not grow at all. |
| none | Counter. Total number of finished (on user request) forwarding tasks on the engine. | Should not grow too fast. |
Proxy Subsystem
Metrics related to proxy / virtual endpoints functionality.
Client ↔︎ Engine
Metric | Labels | Description | Observation |
|---|---|---|---|
| none | Gauge. Configured limit on the number of simultaneous client TCP connections. | - |
| none | Gauge. Number of active incoming client TCP connections accepted by engine. | ⚠️ Should be below 30% of the limit. |
| none | Counter. Total number of accepted incoming client TCP connections. | Should not grow at too fast rate. |
|
| Counter. Total number of abnormally closed/dropped connections. Reason can be:
| Should not grow at too fast rate, especially with |
|
| Counter. Total number of requests received from clients. Updated immediately when request is received and parsed (excluding data). | Rate should be below 1,000 requests/second over 1 minute interval. |
|
| Histogram. Duration of client request processing, from start of the request and until the response is sent to a client. | 95 and 99 percentiles should be below reasonable thresholds. |
|
| Counter. Total number of 3xx HTTP responses to the client. | ⚠️ Should not grow except at very slow rate. |
|
| Counter. Total number of 4xx HTTP responses to the client. | ⚠️ Should not grow except at very slow rate. |
|
| Counter. Total number of 5xx HTTP responses to the client. | ⚠️ Should not grow except at very slow rate. |
|
| Counter. Total bytes uploaded (client → engine) by all clients. | ⚠️ Rate should not drop much below average. Rate should be below 100 MB/s over 5 minutes (depending on engine VM size). |
|
| Counter. Total bytes downloaded (engine → client) by all clients. | ⚠️ Rate should not drop much below average. Rate should be below 100 MB/s over 5 minutes (depending on engine VM size). |
Engine ↔︎ Cloud
Metrics from this section are not available yet
Metric | Labels | Description | Observation |
|---|---|---|---|
|
| Gauge. Number of active TCP connections to cloud providers. | Should not grow over long term and should not be too high. |
|
| Counter. Total number of connections ever established to cloud providers. | Should not grow at too fast rate. |
|
| Counter. Total number of failed connections to cloud providers. | Should not grow except at very slow rate. |
|
| Counter. Total number of abnormally dropped connections to cloud providers (for example closed by cloud or by timeout) | Should not grow except at very slow rate. |
|
| Counter. Total number of requests to clouds, successful or not. | Rate below 1,000 requests/second over 1 minute interval. |
|
| Counter. Engine-initiate retries of requests to clouds (such as when cloud drop connection before we can send request head). | Should not grow fast. |
|
| Histogram. Time it takes to complete requests to clouds. | 95 and 99 percentiles of the sum should be below reasonable thresholds. |
|
| Counter. Number of 3xx responses from clouds. | Should not grow except at very slow rate. |
|
| Counter. Number of 4xx responses from clouds. | Should not grow except at very slow rate. |
|
| Counter. Number of 5xx responses from clouds. | Should not grow except at very slow rate. |
|
| Counter. Total bytes uploaded (engine → cloud) to clouds. | Sum rate below 100 MB/s over 5 minutes (depending on engine VM size). |
|
| Counter. Total bytes downloaded (cloud → engine) from clouds. | Sum rate below 100 MB/s over 5 minutes (depending on engine VM size). |
Labels
Most metrics include labels to improve monitoring granularity.
cloud_codeidentifies cloud provider. The list of provider codes is at https://api.flexify.io/providers.cloud_operationtells what S3 operation a client requested.cloud_operationtells what cloud-native operation engine is performing in the cloud.
Operation can be one of:
UNKNOWN
OPTIONS
delete_object
delete_objects
copy_object
get_object
list_objects
probe_object
put_object
list_multipart_uploads
initiate_multipart_upload
complete_multipart_upload
abort_multipart_upload
put_object_part
list_buckets
get_location
put_bucket
probe_bucket
delete_bucket
list_parts
get_bucket_versioning
list_object_versions
restore_object
copy_object_part
get_acl
put_object_tagging
get_object_tagging
delete_object_tagging
get_object_attributes
Cardinality
Native histograms are currently not supported for engine metrics due to Prometheus C++ SDK limitations.
Currently maximum cardinality is produced by the fl_eng_proxy_client_request_duration_seconds metric:
Count, sum, and 17 time buckets (0.01, 0.02, 0.05, 0.1, 0.2, 0.5, 1, 2, 5, 10, 20, 50, 100, 200, 500, 1000, Inf seconds)
29 possible
client_operation
Total max cardinality: 19 * 29 = 551.
If some operations are not used, sequences with corresponding labels are not produced.